PLOT — the Plot dialog
 Ribbon: Output ▸ Plot ▸ PlotCommand:
PLOTAlias: PRINT, PDF
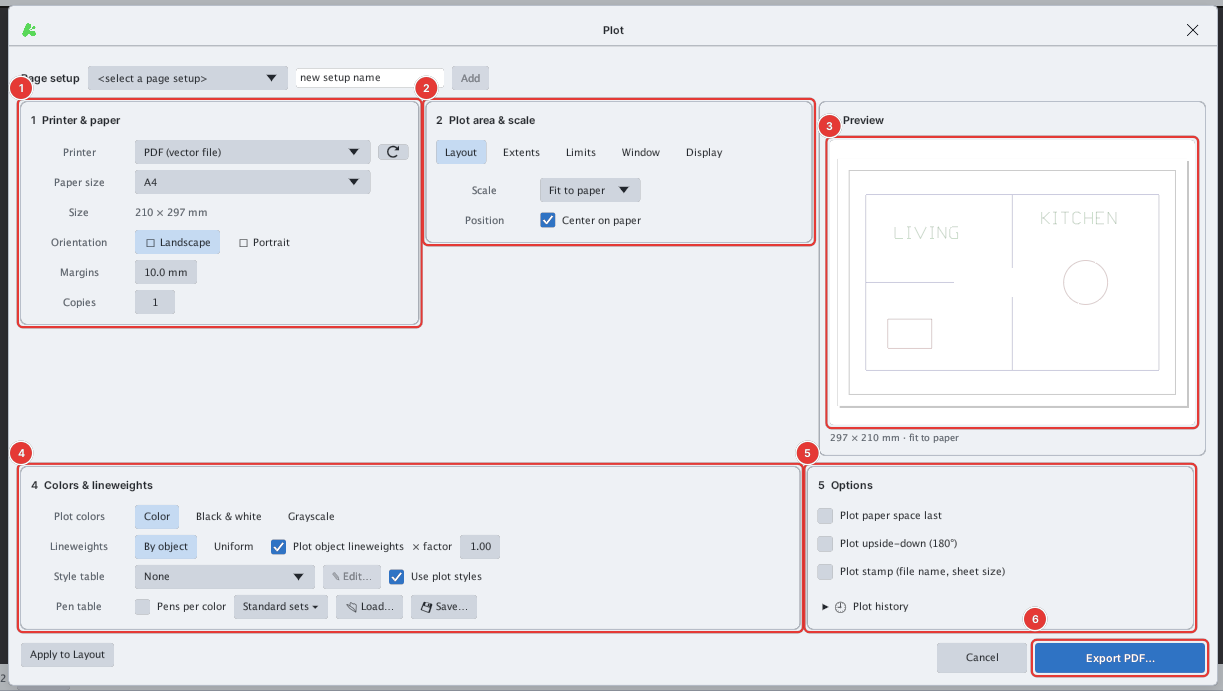
PLOT opens the Plot dialog. Choose the printer (or PDF), paper size, plot area, scale, colours and lineweights, then click the plot button to create a PDF file or send the job to a printer.
The dialog works on the Model tab and on layouts; on a layout the plot area defaults to the whole sheet.
Typing PLOT from a script or automation asks Enter file name: first (because FILEDIA = 0) before the dialog. In normal use just click Plot or type PLOT.
The items in the dialog
The top row is Page setup: pick an existing page setup, or type a name and click Add to save the current settings.
- Printer & paper 1
- Printer: PDF (vector file) or one of the system printers (⟳ reloads the list).
- Paper size: A4, A3, A2, A1, A0, A5, Letter, Legal, Tabloid or Custom… (width × height in mm).
- Orientation (landscape / portrait), Margins (10 mm by default), Copies (for a printer).
- Plot area & scale 2
- The plot area (table below), Scale and Center on paper.
- Clear Center on paper to type an X / Y offset (mm).
- Preview 3
- The real printout on the sheet (colours, lineweights, text, Window clipping), updated as you change settings.
- The sheet size and scale are shown below it.
- Colors & lineweights 4
- Plot colours, lineweights, the
.ctb/.stbplot style table and the pen table per colour (see Plot colours and lineweights).
- Plot colours, lineweights, the
- Options 5
- Plot paper space last, Plot upside-down (180°), Plot stamp (file name + sheet size along the margin).
- Plot history lists recent plots.
- The plot button 6
- Names the target: Export PDF… for PDF, Print to printer name for a printer.
- Apply to Layout stores the settings in the current layout; Cancel closes the dialog.
Plot area
| Button | What it plots |
|---|---|
| Layout | The whole sheet of the current layout at 1:1 (layout tabs only) |
| Extents | Every object in the model |
| Limits | The drawing LIMITS (set LIMITS first, otherwise the command line says PLOT: LIMITS is not set.) |
| Window | A rectangle: click Window then pick two corners on the drawing; afterwards edit the From / to coordinates or click Pick window on the drawing < to pick again |
| Display | What is currently on screen |
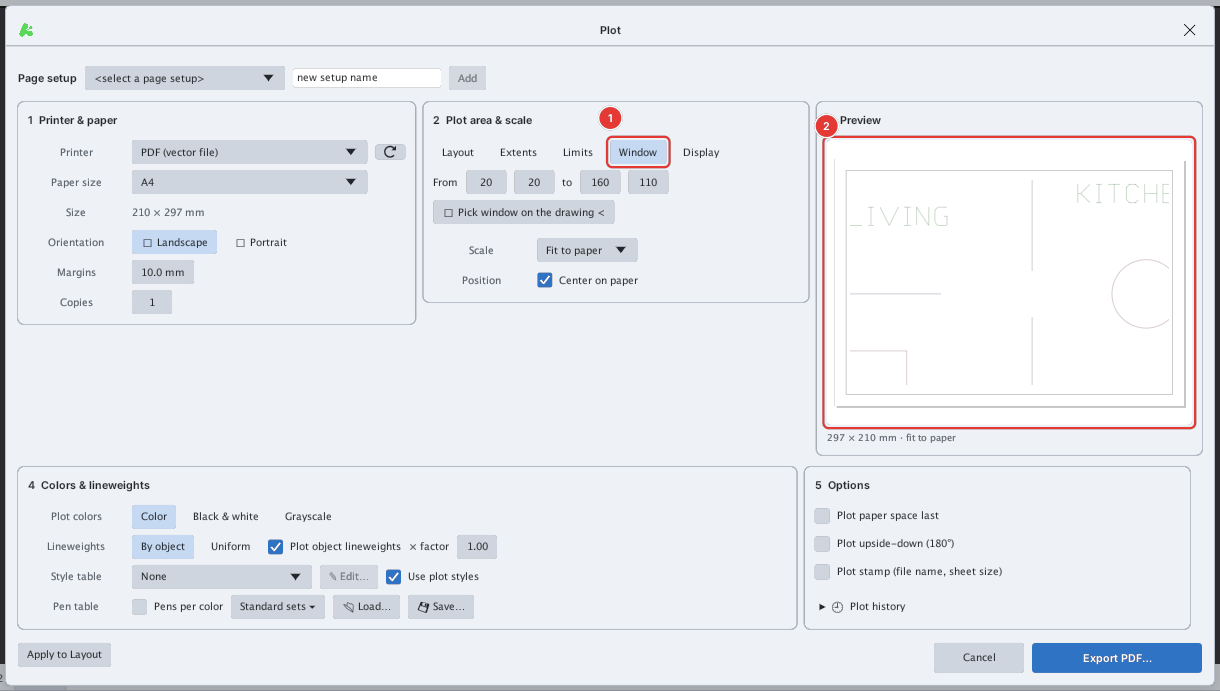
Click Window: the dialog closes for a moment and the command line asks PLOT: specify the first corner of the plot window…. Pick two corners and the dialog comes back. Only objects inside the window are plotted (anything crossing the edge is cut exactly at the window).
Scale
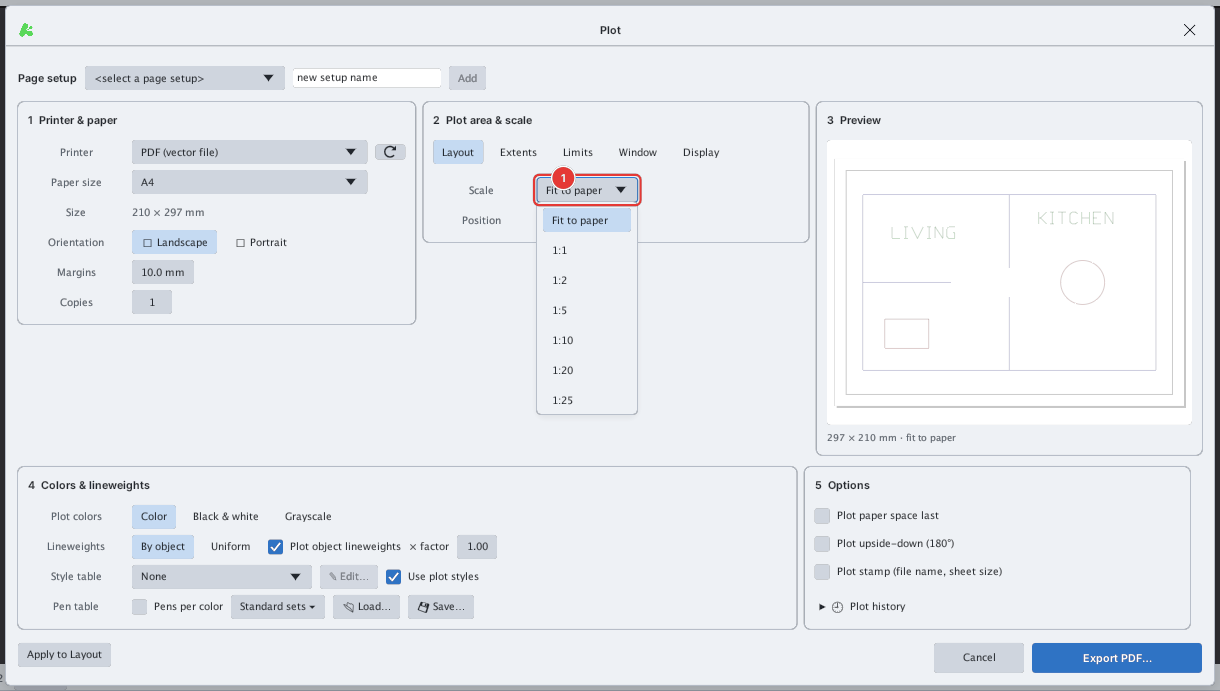
Fit to paper fits the plot area to the sheet (inside the margins). The 1:n / 2:1 scales place the drawing at that scale (1 mm on paper = n drawing units). Custom… lets you type any mm per unit value.
When plotting a layout with the Layout area, the model scale comes from each viewport and this scale applies to the sheet.
Plot colours and lineweights
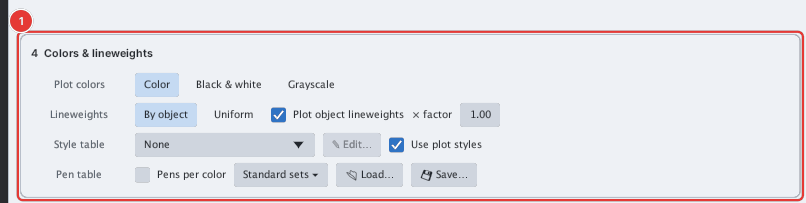
- Plot colors:
- Color: the objects' own colours; colour 7 (white / black) plots black on white paper, as in AutoCAD.
- Black & white: everything black.
- Grayscale: converted to grey levels.
- Lineweights:
- By object: each object's lineweight, with Plot object lineweights and a × factor multiplier.
- Uniform: one width for every line.
- Style table: an AutoCAD
.ctb/.stbplot style table, see Plot style. Edit… opens the table editor. - Pen table: turn on Pens per color to set the plot colour and lineweight for each drawing colour.
- Standard sets ▾ offers ready-made sets:
- Standard pen set — black (ISO 128): red 0.18 · yellow 0.25 · green 0.35 · cyan 0.50 · blue 0.70 · magenta 0.13 · white 0.25 · greys 0.13 / 0.09 mm, plotted black. This is the usual way to plot technical drawings.
- The same set kept in colour.
- Monochrome: black, lineweights by object.
- As displayed: colours and lineweights as drawn.
- Each row picks a plot colour (As drawn / Black / Custom) and a lineweight (By object or a standard width from 0.09 to 1.40 mm).
- Save… / Load… store and reuse a pen table.
- Standard sets ▾ offers ready-made sets:
The Model tab
On the Model tab there is no Layout button; the default plot area is Extents:
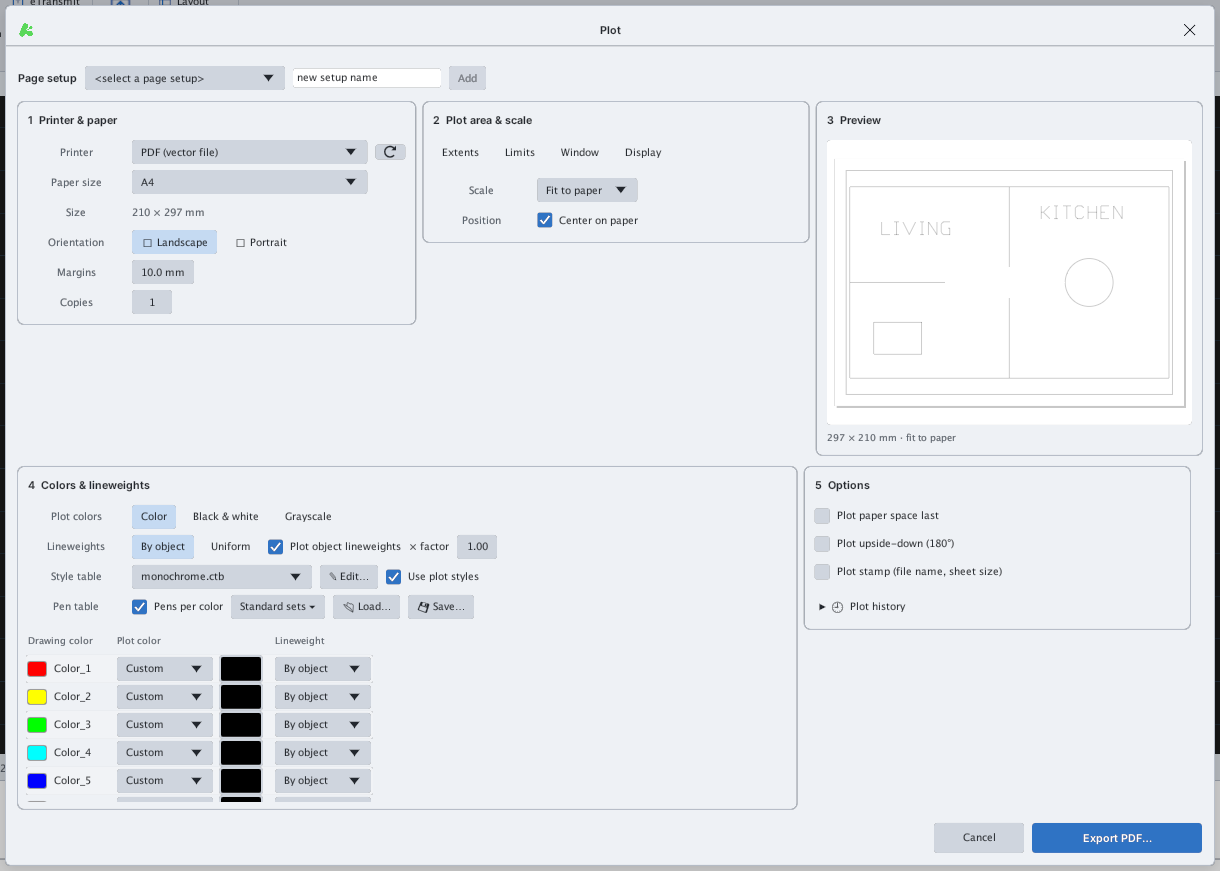
Preview
The Preview box draws exactly what will be printed: colours by the colour mode and pen table, lineweights, text, viewports and Window clipping. White lines show black, as on paper. Very large drawings are simplified in the preview (a Preview simplified note appears); the real printout is not affected.
Plot history
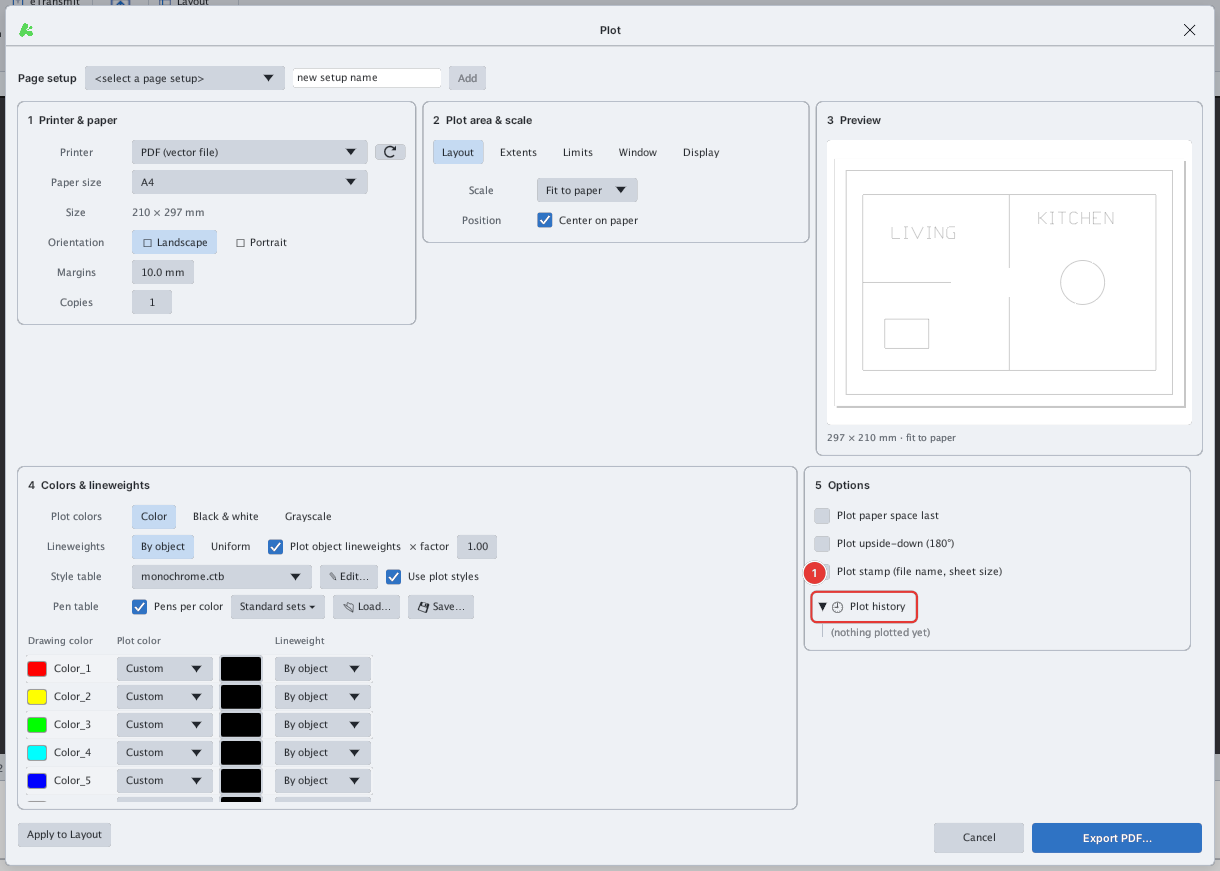
(nothing plotted yet).The result
Click Export PDF… and choose where to save: a vector PDF whose lines and text stay sharp at any zoom.
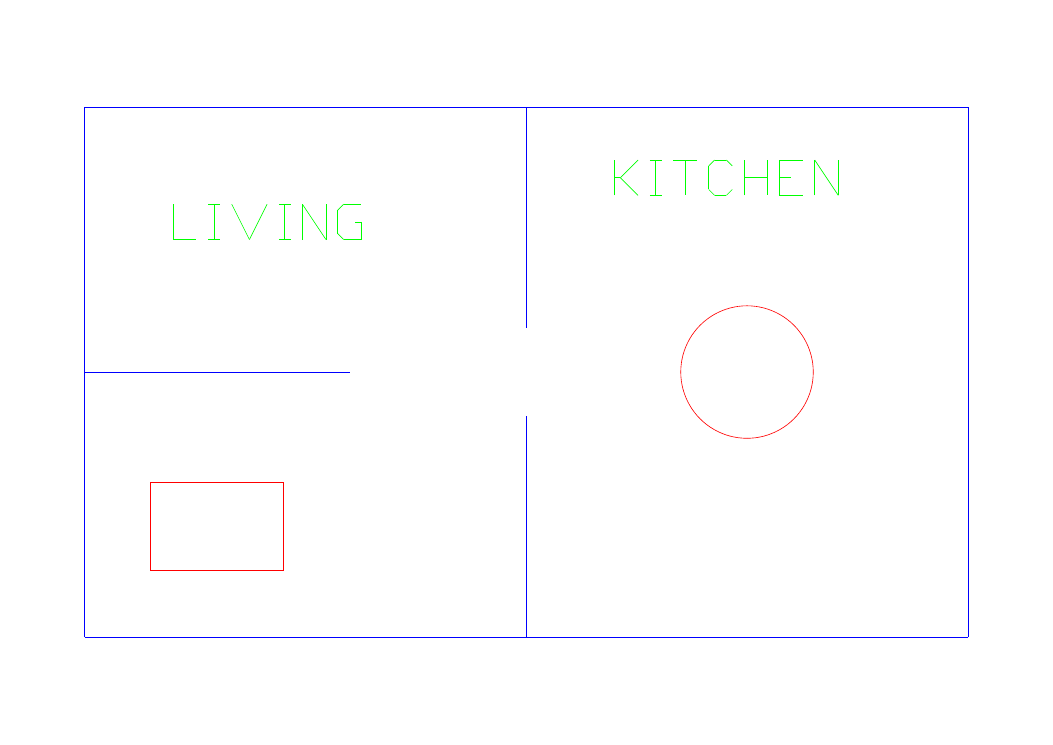
Sheet1 (shown in a PDF viewer).The Export PDF… button opens the operating system's save dialog. For other ways to make a PDF see Export PDF / SVG / PNG; to plot several layouts at once see PUBLISH.